Observability
Logic provides an observability dashboard for each agent, giving you a real-time view of how your agent is performing in production. You can open it from the agent editor using the observability icon in the top bar.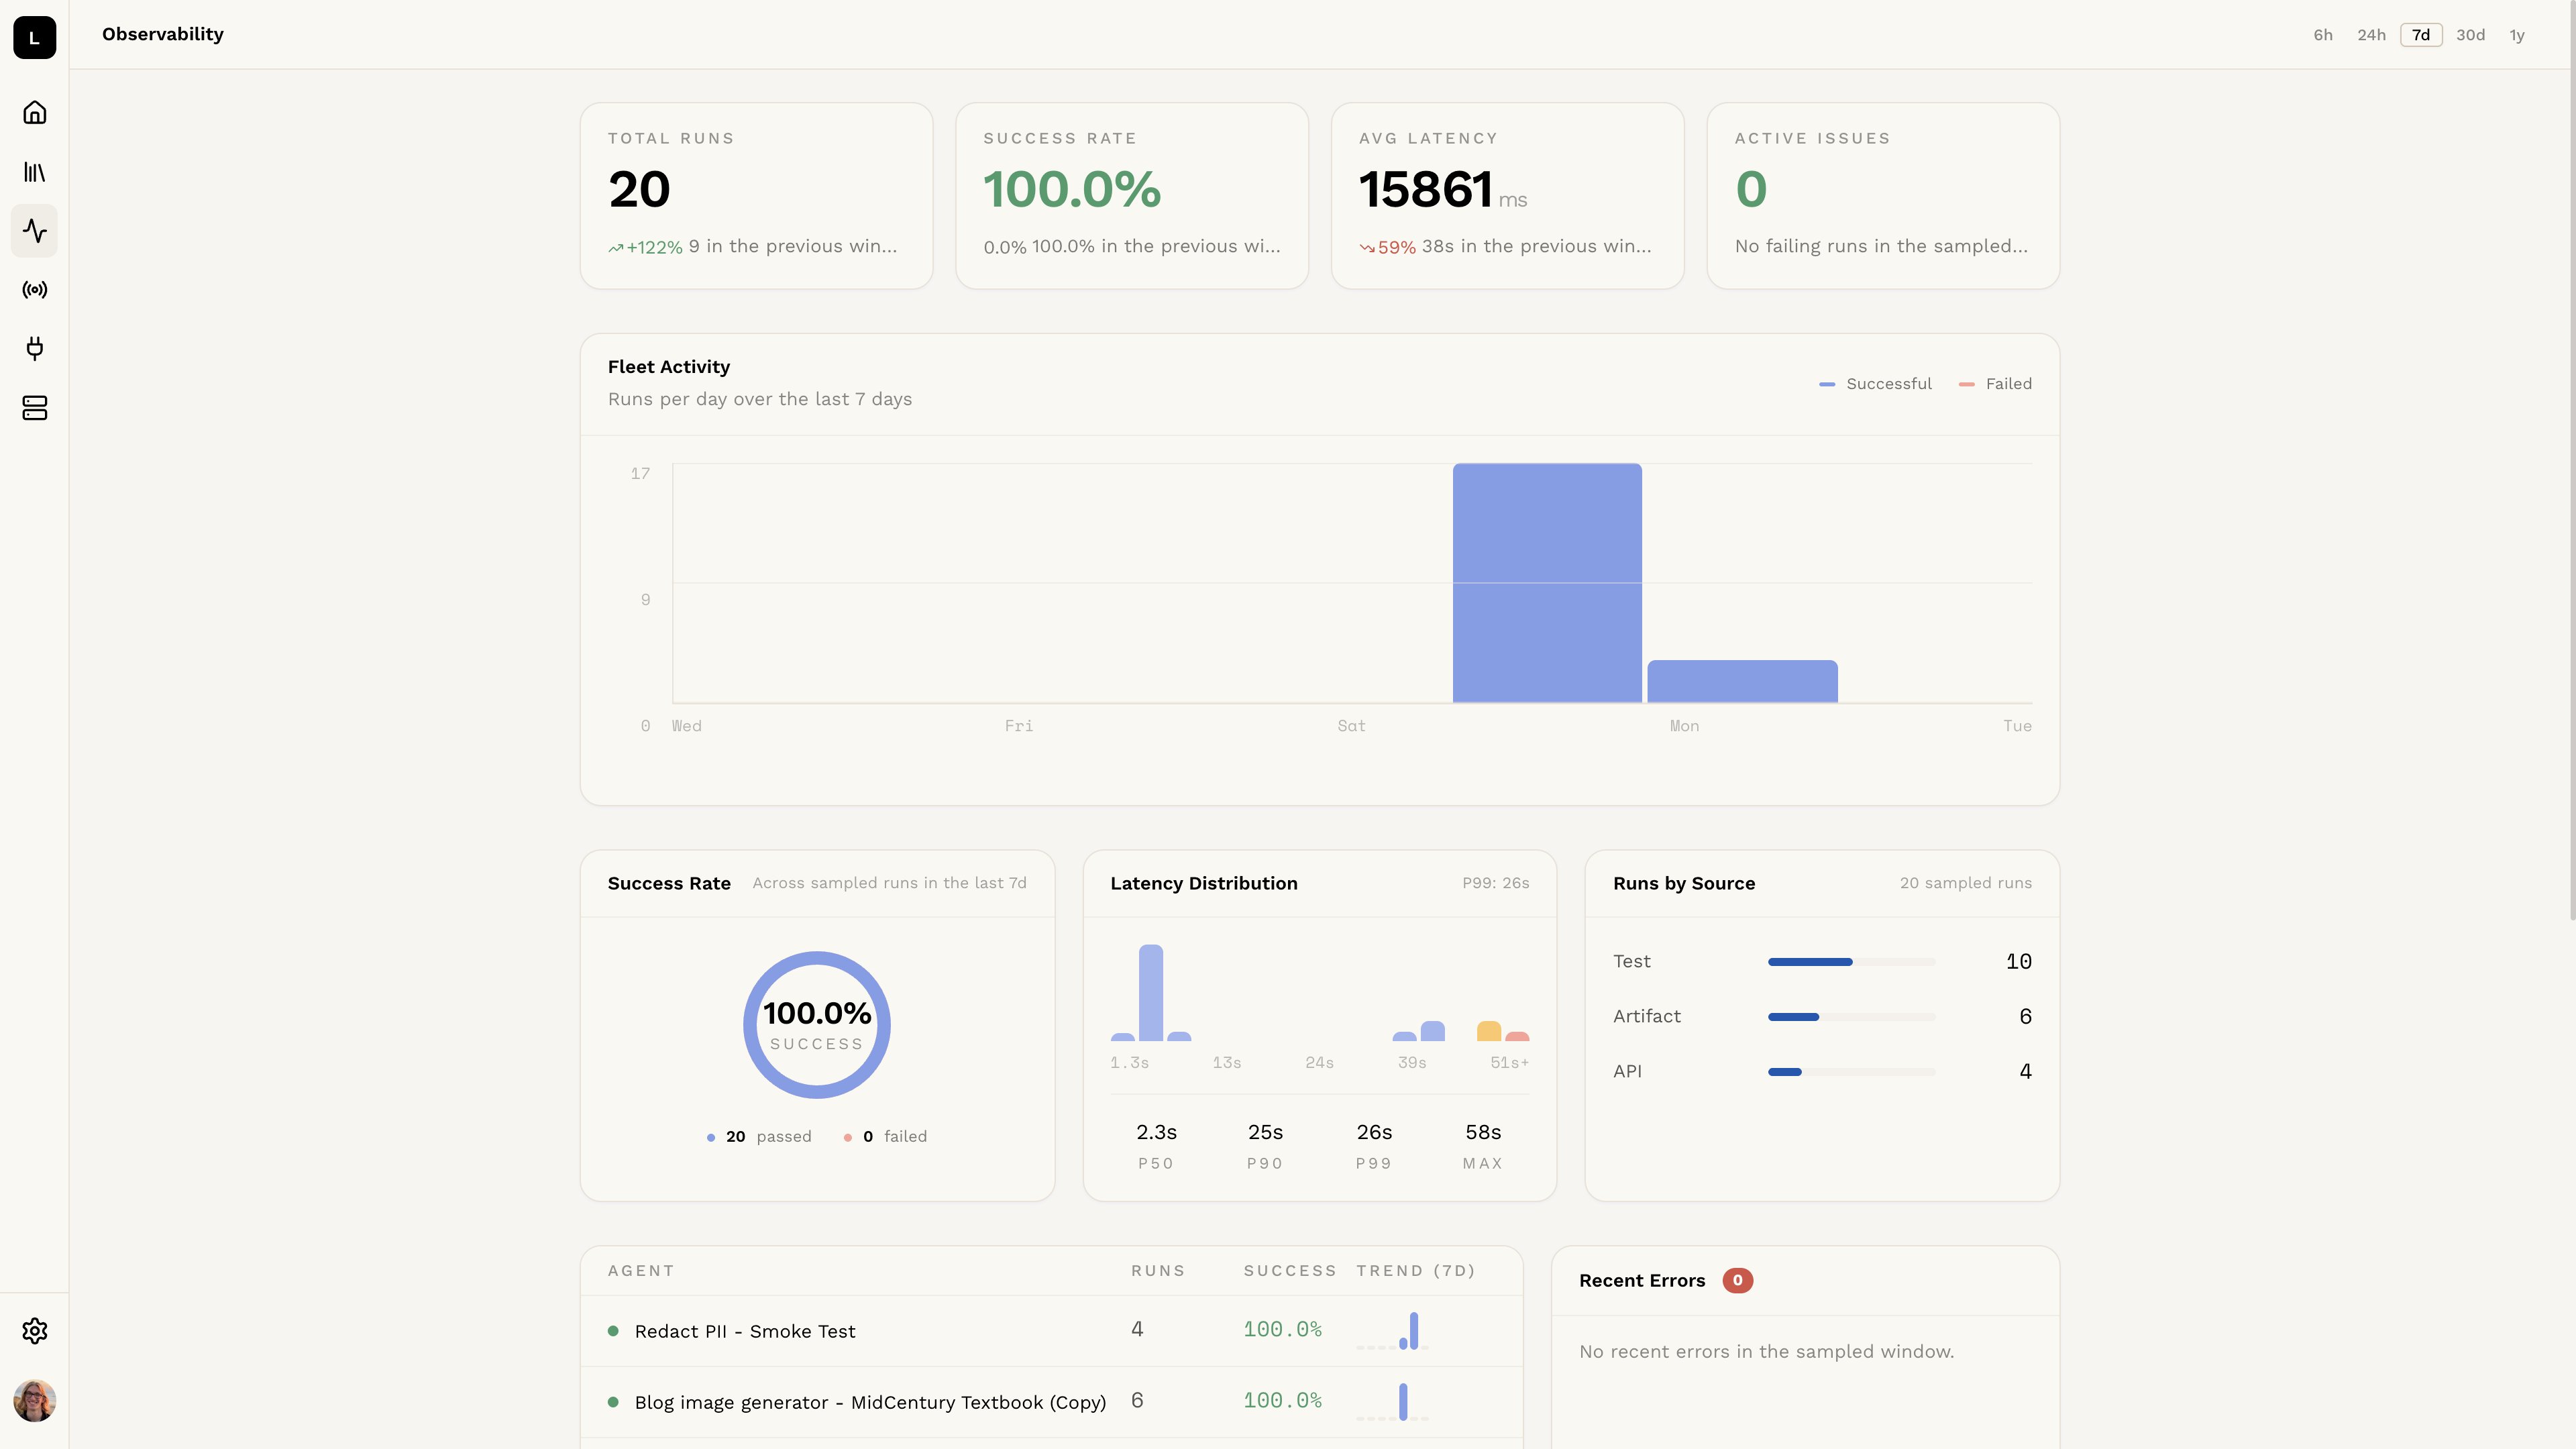
Summary Stats
At the top of the page you’ll find high-level metrics for the selected time range:- Total Runs — the total number of executions
- Success Rate — the percentage of executions that completed successfully
- Avg Latency — the average time taken to execute the agent
- Active Issues — the number of distinct errors currently occurring